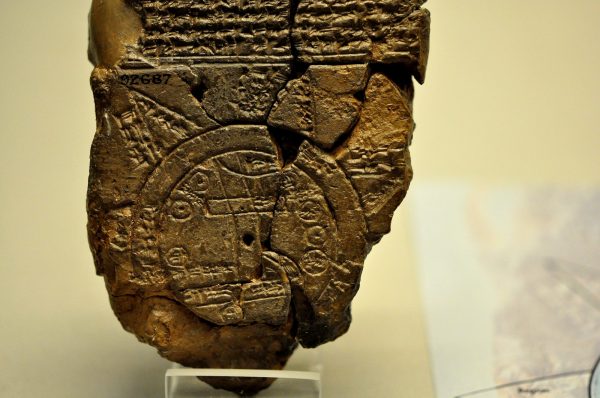
Maps are an old technology. The earliest known world map — the Babylonian Map of the World — was made 2,500 years ago. Its graven clay captures many of the things humans try to show with maps: routes and connections, distances beyond what any one human could see, and changes in the earth and sky over time. The concentric rings of the Babylonian Map of the World are not a mirror image of the world, instead they create a world that a person can hold in their hands. As historian Jerry Brotton explains, "Mapmakers do not just reproduce the world, they construct it."

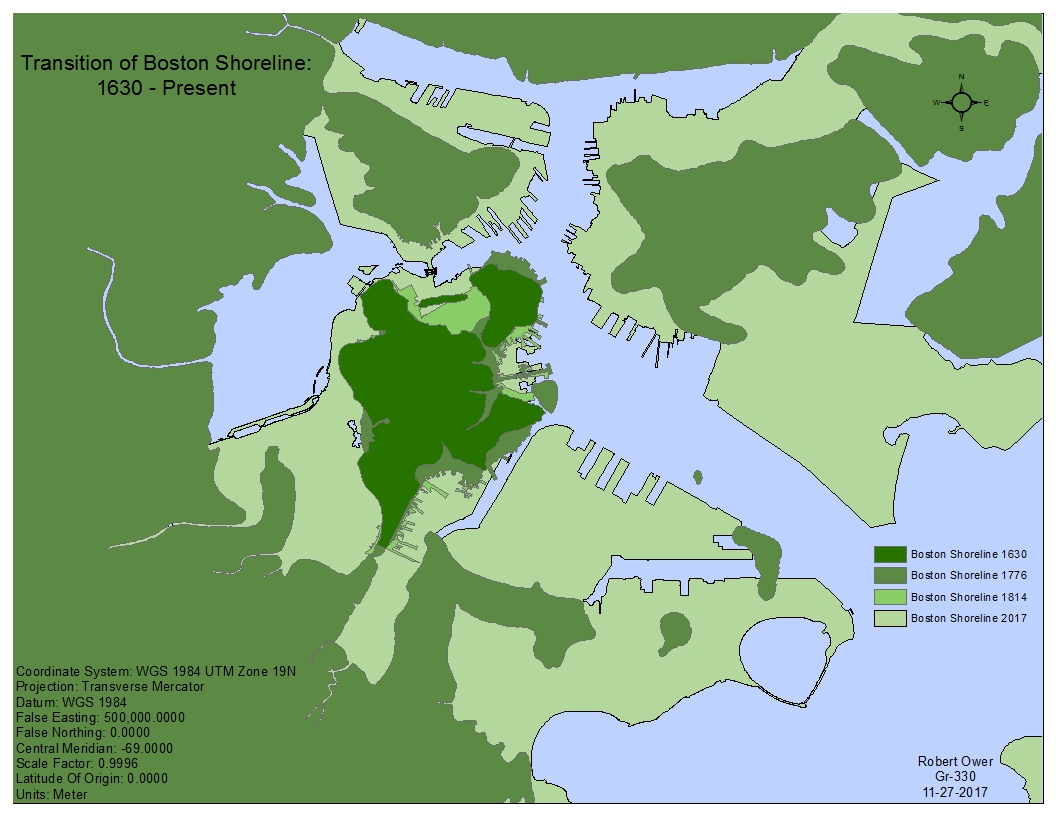
While maps may be ancient, the process of making maps has changed. This map of the Boston shoreline, for example, uses ArcGIS, a new constellation of mapping technologies, to show changes in the waterline over almost 400 years. Lighter shades of green indicate where reclaimed land has pushed out into harbor. History buffs hoping to see where the Boston Tea Party took place might be surprised to find the commemorative plaque on the side of a skyscraper a long way from water.

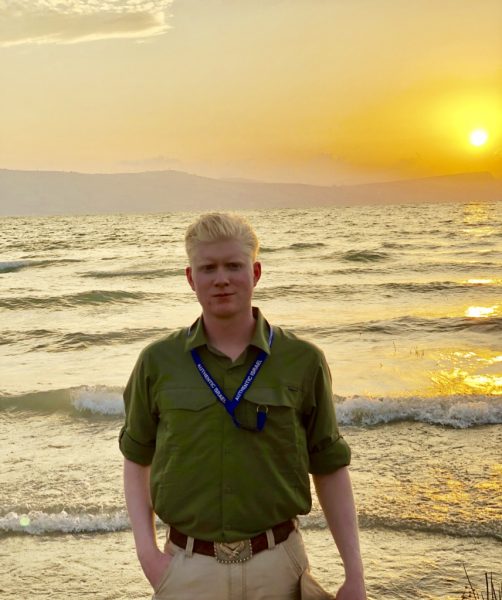
This map's maker is Robert Ower, a recent CSU history alumnus. While his map shows the changing Boston shoreline, it also represents his years at CSU, where he learned how to use mapping software, conduct historical research, build relationships between history and geography, and make connections with faculty and professionals that helped him launch his career.

A Passion for History
Ower ('18) came to CSU with a passion for history. But he soon realized that "the geography of a place influenced what happened historically,” he says. “But there's also a really strong connection between place and memory," which he studied in Dr. Thomas Cauvin's Monuments in History course. Ower soon added a minor in geography and looked for ways to combine the two fields.
That opportunity came when he learned about CSU's Geospatial Centroid, a resource center for geographic information systems. Working with Sophia Linn, the Centroid's assistant director, Ower studied a technology called ArcGIS, an array of mapping software products that allows users to visualize large amounts of data in a map form. "You can use it for anything," Ower says. "You can use it to study the environment or history. Even police departments use it for accident assessment." Data from an Excel spreadsheet, satellite images, or many separate maps can be pulled together into one map with embedded data points.
For Ower, ArcGIS was the perfect tool to combine history and geography. From his history classes, Ower understood that time and place are crucial components — the data — of historical research. The maps that Ower builds, like the Boston shoreline map, layer data into one map that show change over time in natural and human landscapes. In one map, "I could show how coastlines change, how the environment is impacted, and how history gets manipulated," Ower says.
Making a Meaningful Map
Through his training at the Geospatial Centroid, Ower secured an internship at the National Park Service with the National Historic Landmarks Cultural Resources Project. For this internship he honed his skills in collecting mappable data that the NPS could use to find many different kinds of places in the United States that have great historical and cultural significance and that need conservation and preservation.
To create a meaningful map, data has to be mappable — it has to be accurate and standardized. "You need to make sure that your data is all collected the same way, held to the same standards, is stored the same way, so that it can be integrated," he says. The mapping program needs to be able to look at all the data the same way. Otherwise, as Ower put it, "you might get results when you map it, but they're not going to be accurate results."
To find mappable data for the NPS, Ower looked for themes in satellite imagery and historical, geographic, archeological, and legal documents. He used his training in history to search for trends in the large masses of data he worked with. History classes taught him to identify themes in historical and legal documents that appear over time. It's the same for finding mappable data, Ower says: "Whether you're looking at an Excel spreadsheet with a bunch of numbers and names on it or you're looking at satellite imagery, you're looking for a common theme. Once you find that in your data, you can move out from there and make all kinds of connections."
It turns out that finding and producing mappable data is a very marketable skill. Even before he graduated, Ower's work for the NPS caught the attention of researchers at The Center for the Environmental Management of Military Lands (CEMML). They hired him to collect and standardize data about the environmental impacts of US Air Force bases, several of which he had already studied as National Historic Landmarks. After the CEMML project, Ower brought his skill set to CACI International's branch in Fort Collins, where he is an imagery and GIS analyst. He's worked on multiple projects where he analyzes satellite imagery for mappable data and corrects data collected by others.
What is GIS?
A geographic information system (GIS) integrates hardware, software, and data for capturing, managing, analyzing, and displaying all forms of geographically referenced information.
GIS allows us to view, understand, question, interpret, and visualize data in many ways that reveal relationships, patterns, and trends in the form of maps, globes, reports, and charts.
Source: Esri GIS
An Unpredictable Path to, and Through, College
Ower was a legacy student at CSU with family ties all the way back to 1914. But he didn't come to college straight from high school. "Honestly, I thought high school was stupid, and I thought college would be, too," he says. But after three years of moving from job to job - a mechanics shop, a golf course - he knew he wanted more. And he started to see that college was the way to explore ideas he felt passionate about. "I like to be able to do my own research. There are so many people at CSU with a lot of expertise. If I was interested in something, I would just go to a professor's office hours and talk to them."
His curiosity and willingness to talk to people with expertise reflects his view of his career trajectory. "A lot of people think that if you go into history, you can only do history. Or if you do GIS, you'll always do GIS. I don't have that perspective," he says. For Ower, his career options reflect all of the skills and information that he's learned in all of his classes and research projects.
